PRTG Network Monitor is an RMM (Remote Monitoring and Management) tool used by MSPs (Management Service Providers) for asset management. RMM agents are installed on MSP customer endpoints to discover, monitor, and manage IT assets. PRTG Network Monitor can discover WatchGuard devices and use authentication credentials to access specific device information such as subscription status, renewal date, hardware model, and other device properties.
This document describes how to use PRTG Network Monitor to discover and monitor a Wi-Fi in WatchGuard Cloud access point.
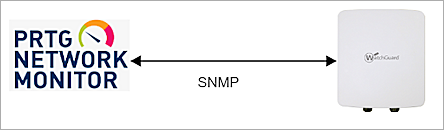
Integration Topology
This diagram outlines the topology used for the PRTG Network Monitor and WatchGuard access point integration.
Before You Begin
Before you begin these procedures, make sure that:
- PRTG Network Monitor is installed on a Windows Server computer (additional charges might apply for the use of PRTG Network Monitor)
- The Wi-Fi in WatchGuard Cloud access point runs firmware version 1.1.24 or higher
- The access point is activated with a WatchGuard USP Wi-Fi Management license and registered to WatchGuard Cloud
Configure SNMP for Access Points
Before you can use PRTG Network Monitor to discover the WatchGuard access point, you must configure SNMP settings for the device.
For more information about how to configure SNMP for your access points in WatchGuard Cloud and view the details of the SNMP MIB file, see Configure SNMP for Access Points.
- Log in to WatchGuard Cloud with the account that manages the access point.
- Select Configure > Devices.
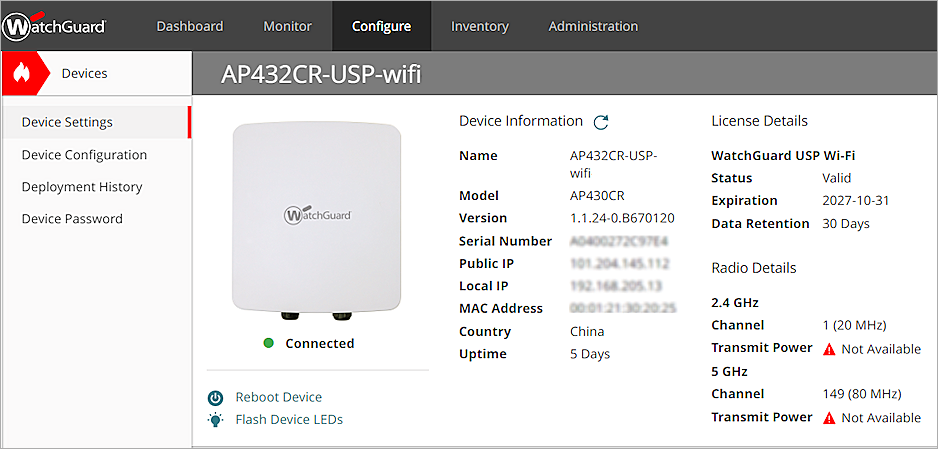
- Select the access point.
The Device Settings page opens. - Select Device Configuration.
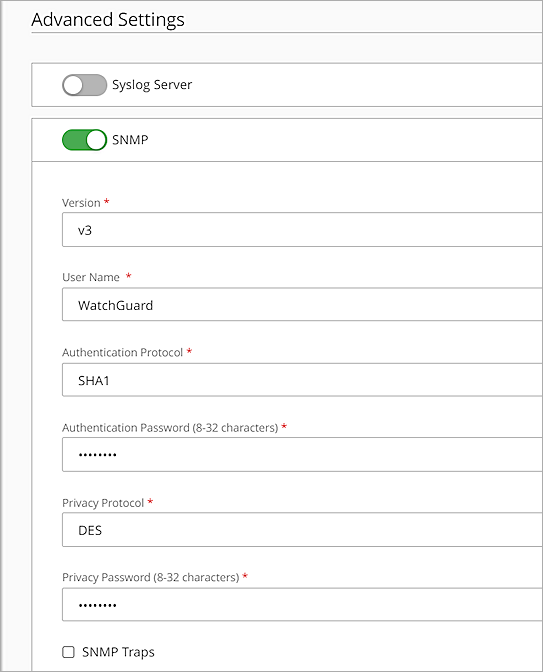
- In the Settings tile, select Advanced Settings.
- Enable SNMP.
- From the Version drop-down list, select v3.
- In the User Name text box, type a user name to authenticate with the SNMP management system. In this example, we type WatchGuard.
- From the Authentication Protocol drop-down list, select SHA1.
- In the Authentication Password text box, type an authentication password.
- From the Privacy Protocol drop-down list, select DES.
- In the Privacy Password text box, type a password to encrypt outgoing messages and decrypt incoming messages.
- Click Save.
PRTG Network Monitor Configuration
Follow the steps in the these sections to configure PRTG Network Monitor for integration with WatchGuard access points.
Add a Group
- Log in to the PRTG Web UI with an admin account.
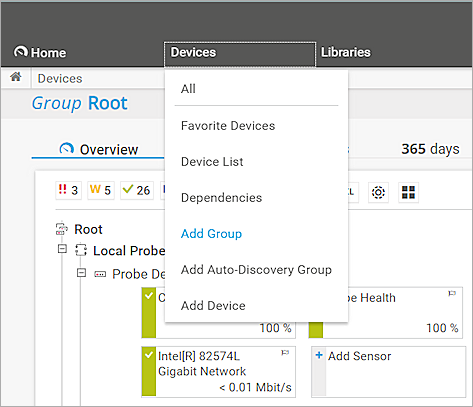
- Select Devices > Add Group.
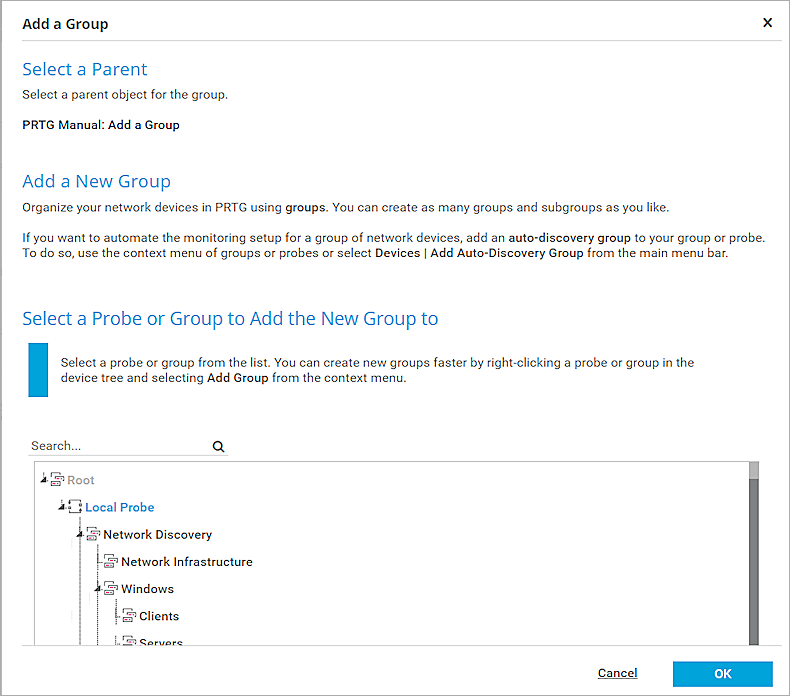
- From the Group list, select Local Probe.
- Click OK.
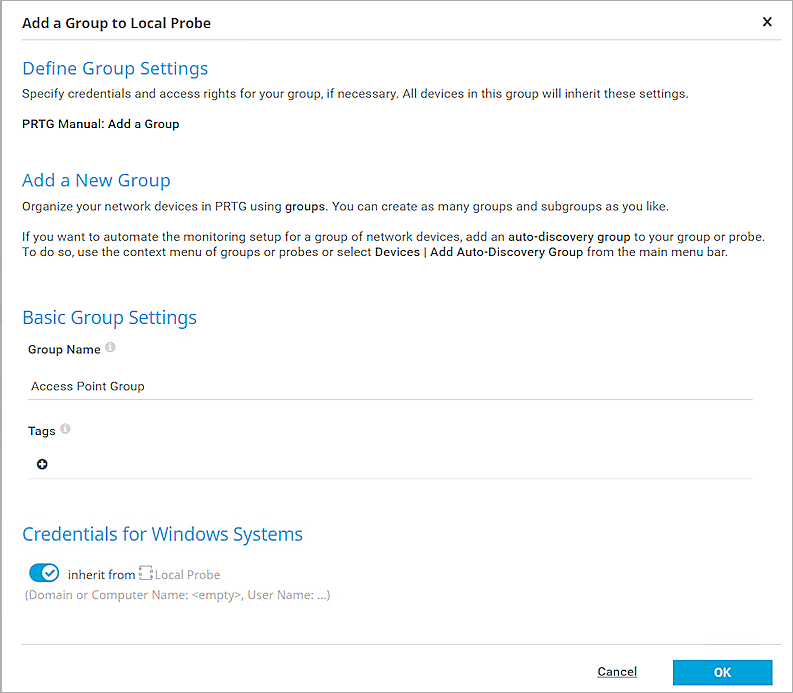
- In the Group Name text box, type a group name. In this example, we type Access Point Group.
- Click OK.
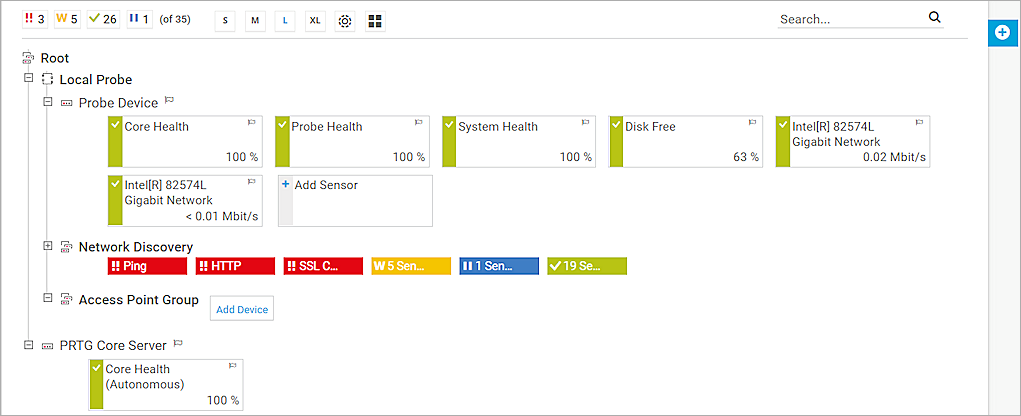
- The group you added appears in the group list.
Add a Device
- Select the group you added.
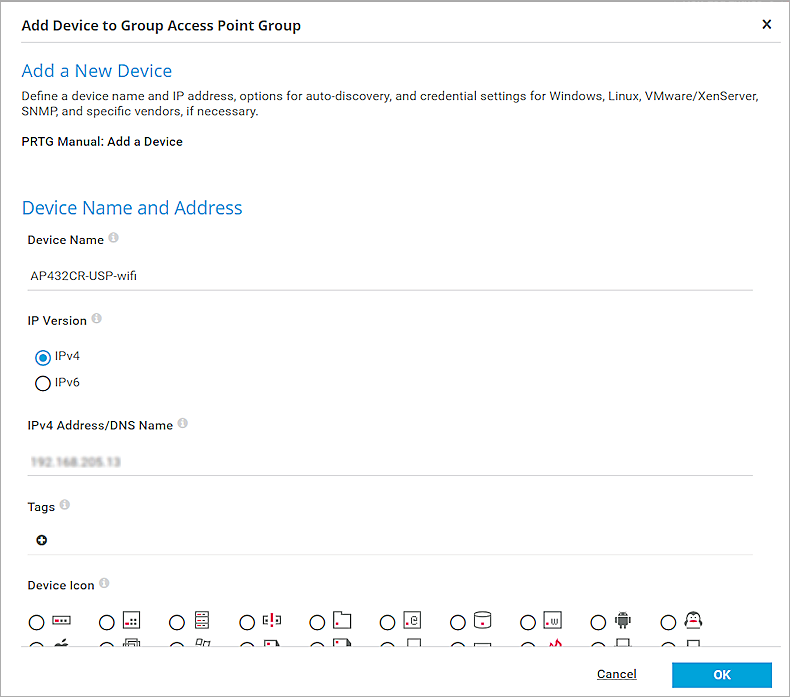
- Click Add Device.
The Add Device to Group dialog box appears. - In the Device Name text box, type a device name. In this example, we type AP432CR-USP-wifi.
- In the IPv4 Address/DNS Name text box, type the IP address of your access point.
- In the Device Icon list, select the WatchGuard device icon.
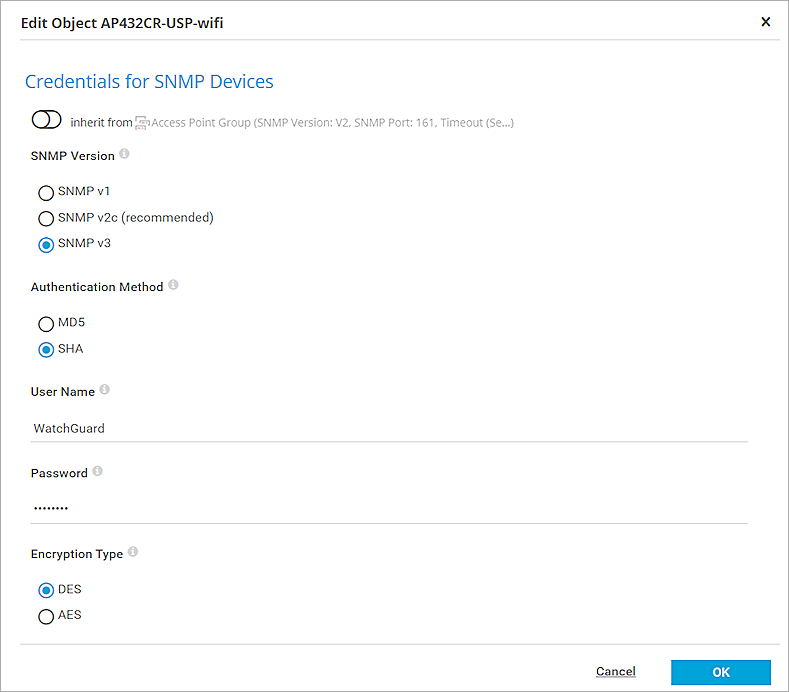
- In the Credentials for SNMP Devices section, clear the Inherit from Local Probe check box.
- In the SNMP Version section, select SNMP v3.
- In the Authentication Method section, select SHA.
- Type the user name and password you specified in the Access Point SNMP authentication settings.
- In the Encryption Type section, select DES.
- Type the encryption password you specified in the Access Point SNMP privacy settings.
- Leave the Context Name text box blank.
- Click OK.
Add SNMP Custom Sensors
- Go to the Devices tab. The new device is displayed at the bottom of the page.
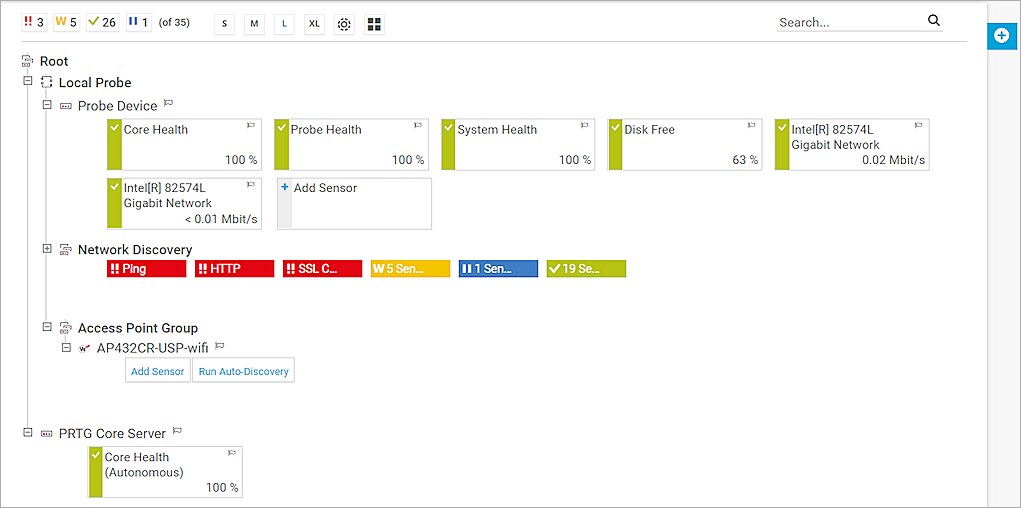
- In the group for your access point, click Add Sensor. In our example, this group is named Access Point Group.
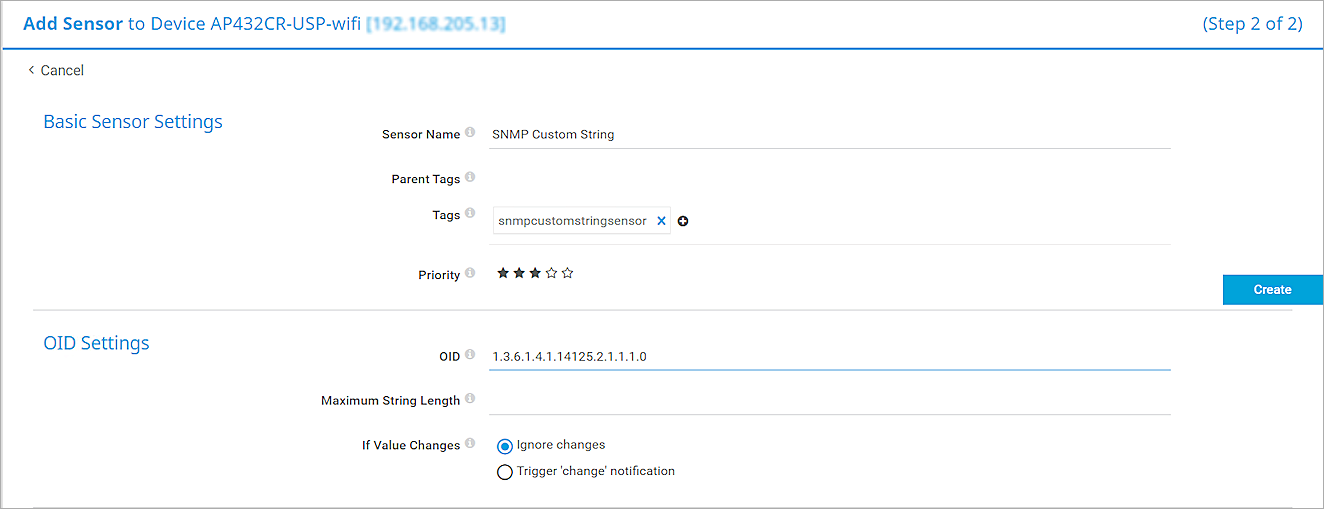
The Add Sensor to Device settings open. - In the Search
 text box, type SNMP Custom.
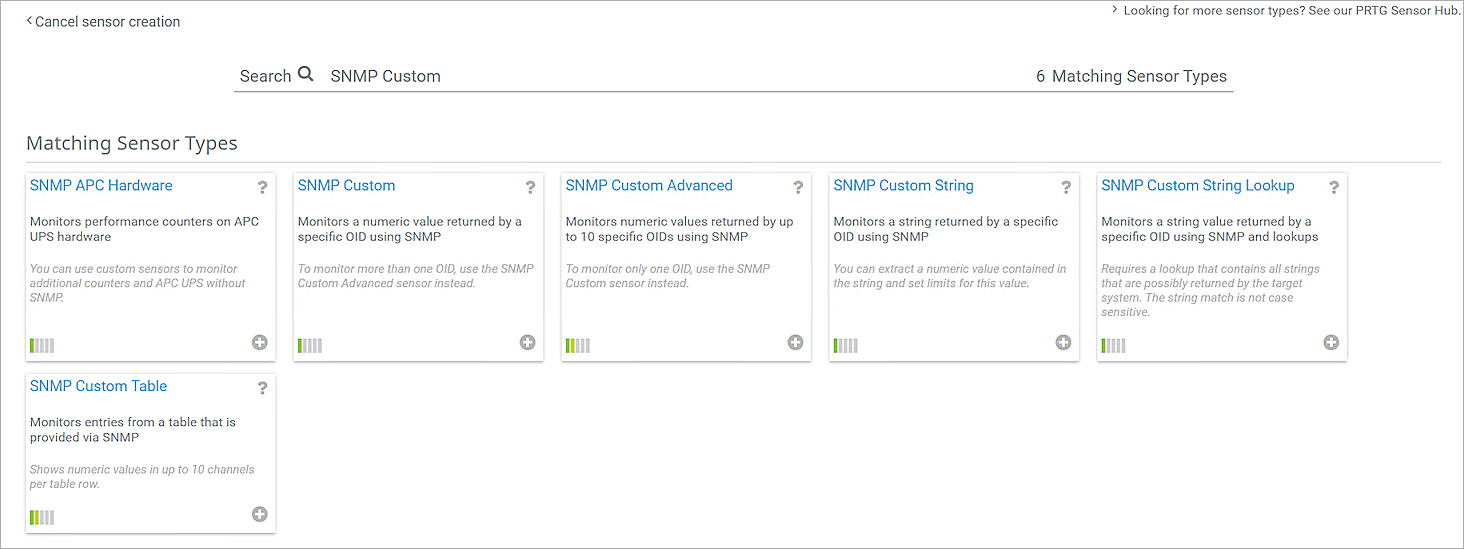
- In the Matching Sensor Types section, select SNMP Custom String.
The Add Sensor to Device settings appear. - In the OID Settings section, type a value for the OID.
- Click Create.
For PRTG Network Monitor to correctly obtain the access point name, serial number, and time zone information, you must repeat this step three times to create sensors with these values:- Access Point Device Name OID —1.3.6.1.4.1.14125.2.1.1.1.0
- Access Point Serial Number OID — 1.3.6.1.4.1.14125.2.1.1.12.0
- Access Point Time Zone OID — 1.3.6.1.4.1.14125.2.2.6.4.0
- Go to Devices > [Device Name]. In this example, the device name is AP432CR-USP-wifi.
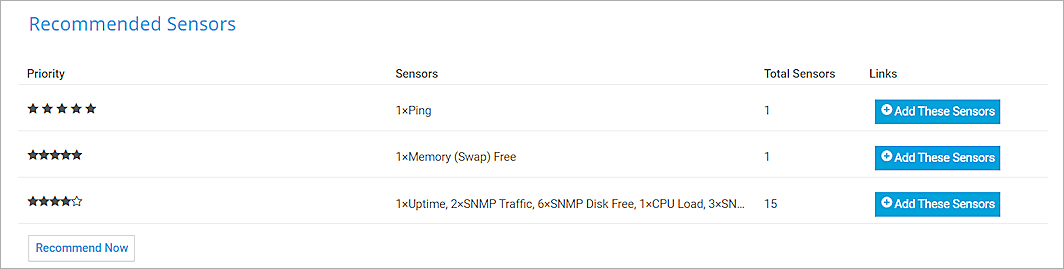
- In the Recommended Sensors section, click Recommend Now to search sensors for the device, then click OK to confirm. This process may take several minutes.
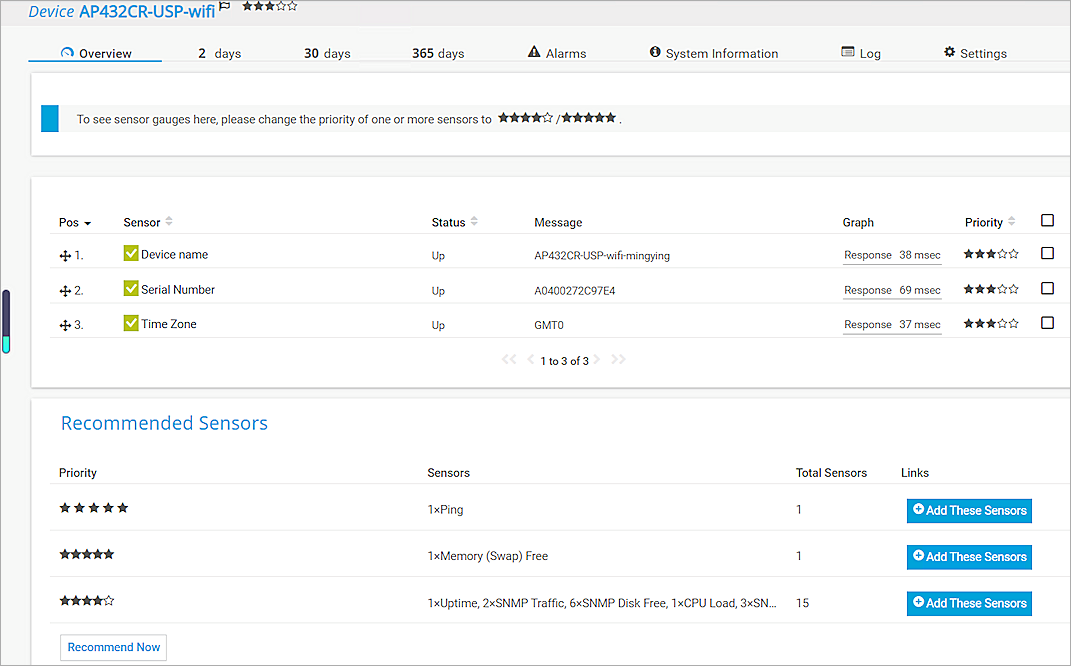
- After the recommendation process completes, click Add These Sensors to auto-deploy the sensors to devices, then click OK to confirm.
Test the Access Point and PRTG Network Monitor Integration
To test the PRTG Network Monitor integration with the WatchGuard access point:
- On the Devices page, find the access point you added.
- Click the device name. In this example, the device name is AP432CR-USP-wifi.
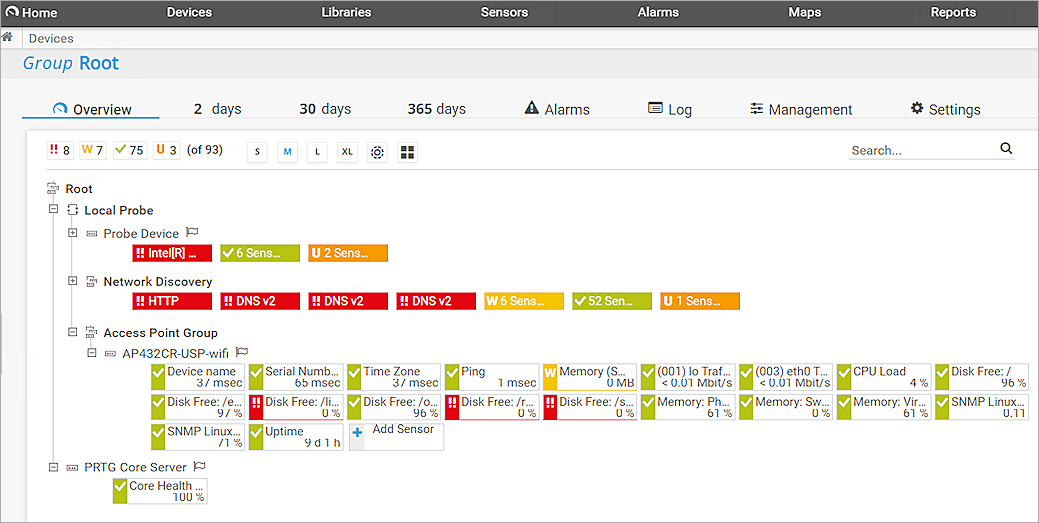
- You can view the Device name, Serial Number, Time Zone and other sensors in the list.
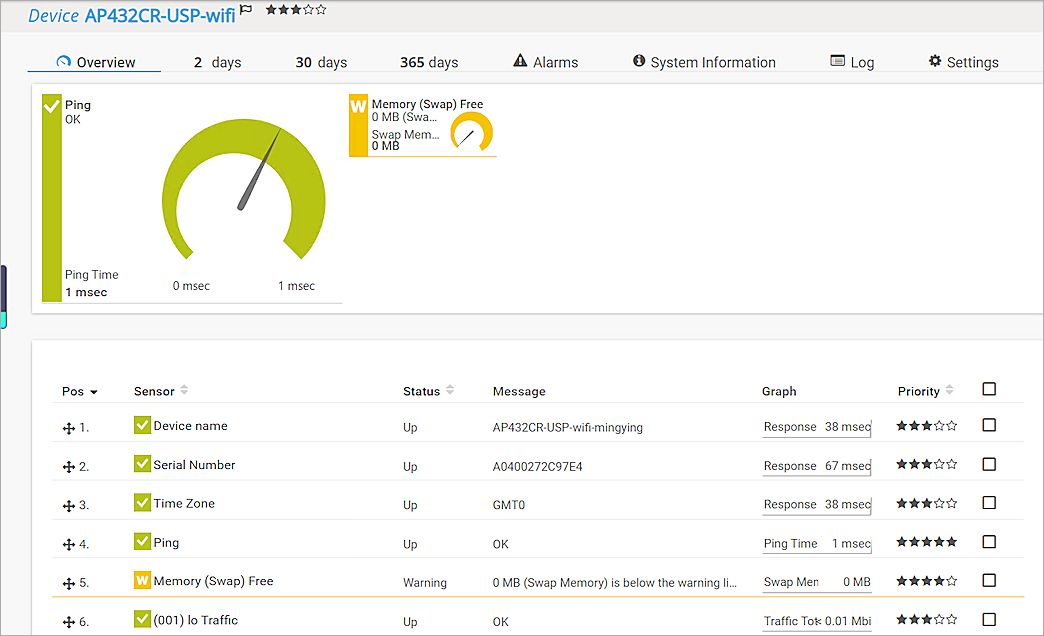
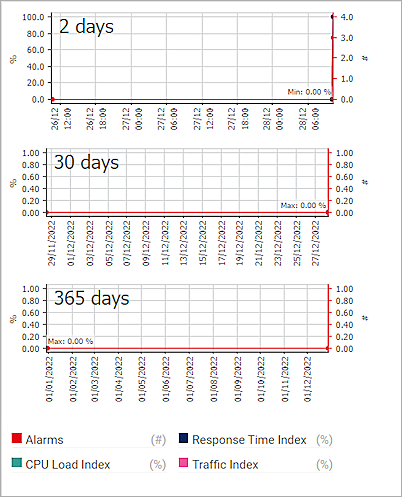
- On the right panel, you can view data and charts about Access Point Alarms, Response Time Index, CPU Load Index, and Traffic Index. Each item has three charts to show the statistics for 2 days, 30 days and 365 days.